About LLRL
Why LLRL?
Crops are essential to human survival and the advancement of society, serving as a critical food source. It is projected that global food production needs to increase by 50\% by 2050 to meet the demands of a growing population. However, crop yields are frequently threatened by various plant leaf diseases, which reduce annual output by approximately 13% to 22%, leading to significant agricultural losses. Deep learning technology has made remarkable strides in plant leaf disease recognition, achieving over 90% accuracy due to its powerful feature extraction and automatic learning capabilities, but it is limited to disease identification without providing precise guidance on pesticide dosage. This limitation contributes to issues such as reduced crop yields, environmental pollution, economic losses, and missed optimal treatment windows. Therefore, assessing the severity of plant leaf diseases is crucial for achieving intelligent crop management and improving food production.
Traditional evaluation methods are highly subjective and labor-intensive, and are not suitable for large-scale data. Machine learning-based methods have achieved a certain degree of automated evaluation, but the performance of these machine learning methods heavily depends on high-quality feature engineering. Deep learning methods have further promoted the development of evaluation in a more accurate and simpler direction. However, these methods mainly rely on global image disease features and can easily mistake background information for the lesion area, resulting in a bias in the severity assessment, as shown in Figure 1. To address this issue, we adopt a location-guided learning strategy to acquire prior knowledge of the lesion area, allowing us to extract features focused on this region.
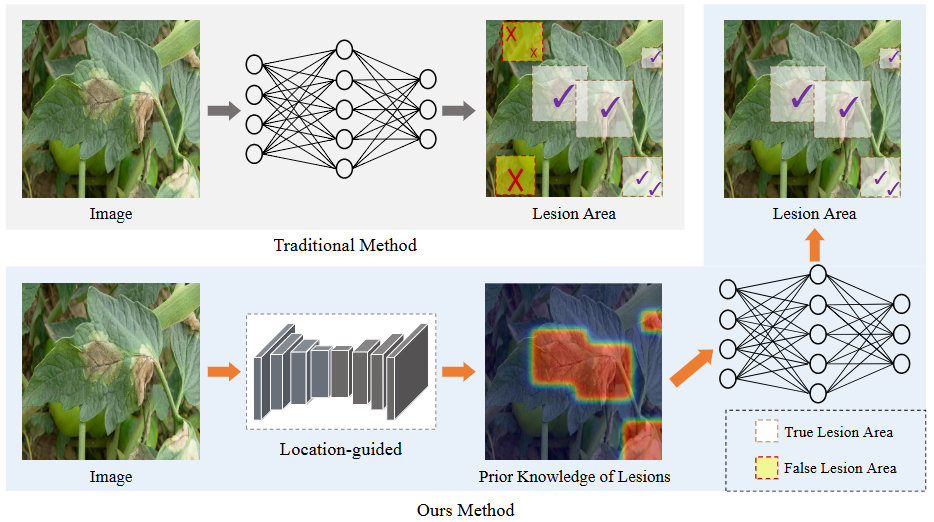
Figure 1: Comparison of existing deep learning methods and our approach. The true area indicates the correctly identified lesion, while the false area denotes misidentified lesions. Traditional methods rely on global learning, which often confuses background with lesion areas. In contrast, our approach utilizes location-guided to effectively eliminate background interference.
Why IG-Net?
LGR-Net requires paired plant healthy-diseased images, yet it is extremely challenging to capture both healthy and diseased states of the same leaf simultaneously. To address this issue, we generate diseased images from healthy leaf images using an image generation model. The diffusion model, widely adopted in artificial intelligence applications, has shown impressive results, prompting us to implement it as the Image Generation Network (IG-Net) to create plant healthy-diseased image pairs.
Real-world Application
We propose a location-guided intelligent representation learning method for assessing the severity of plant leaf diseases, offering robust technical support for modern agricultural production. Specifically, based on the evaluation results, farmers can implement precise pesticide application in areas with varying disease severity, thereby avoiding resource waste and minimizing the environmental impact of large-scale spraying. As illustrated in Figure 2(a), diseased leaves can be captured using mobile phones and uploaded to the evaluation model for analysis. The system can further combine agricultural knowledge to automatically calculate the optimal pesticide application time and dosage, further improving the precision of crop management. Additionally, as shown in Figure 2(b), this approach can be integrated with technologies such as drones and satellite remote sensing to enable automated and intelligent large-scale farmland disease assessment. By regularly collecting crop images, the evaluation model can swiftly and accurately analyze disease severity without requiring human intervention, significantly reducing the manual inspection workload. Moreover, based on the intelligent inspection results, automatic pesticide application can be achieved.
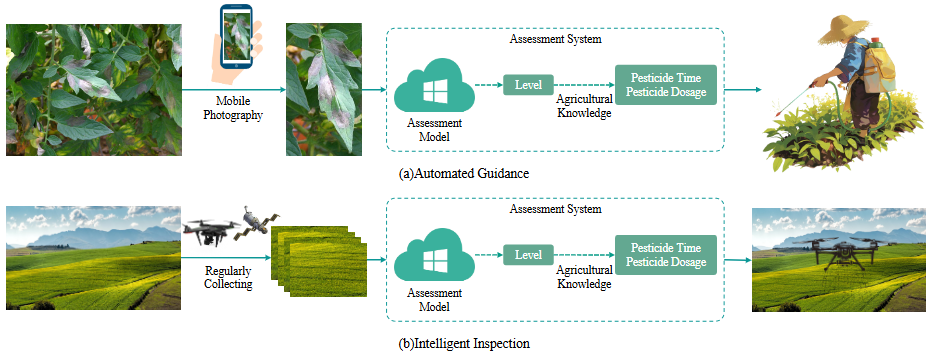
Figure 2: Practical applications of assessing the severity of plant leaf diseases. Including automated guidance, intelligent inspection, and expansion into fruit disease assessment. The figure illustrates (a) automated guidance and (b) intelligent inspection as examples.
Research Team
SAMLab