LLRL:
Location-guided Lesions Representation Learning via Image Generate for Assessing Plant Leaf Diseases Severity
Introduction
The LLRL method comprises two key components: the location-guided lesion representation learning network (LGR-Net) and the hierarchical lesion fusion evaluation network (HLFA-Net). Additionally, an image generation network (IG-Net) is used to synthesize healthy-diseased image pairs for training LGR-Net. LGR-Net follows an encoder-decoder architecture and is designed to train a dual-branch feature encoder (DBF-Enc) using healthy-diseased image pairs. This encoder incorporates prior knowledge of disease regions, enabling it to extract focal visual features for HLFA-Net. HLFA-Net leverages the pre-trained DBF-Enc from LGR-Net to capture multi-level visual features, which are further refined using a hierarchical lesion fusion module, leading to accurate disease severity classification. To optimize the network's learning process, LGR-Net is trained using binary cross-entropy and dice loss, while HLFA-Net utilizes cross-entropy loss. These combined loss functions guide the model to focus effectively on the lesion area, ensuring precise severity assessment. This method offers a novel and reliable solution for the accurate evaluation of plant leaf disease severity, contributing to improved intelligent disease management and prevention.
Dependencies
- CUDA 11.8
- Python 3.8 (or later)
- torch==1.13.1
- torchaudio==0.13.1
- torchcam==0.3.2
- torchgeo==0.4.1
- torchmetrics==0.11.4
- torchvision==0.14.1
- numpy==1.21.6
- Pillow==9.2.0
- einops==0.6.0
- opencv-python==4.6.0.66
GitHub: https://github.com/GZU-SAMLab/LLRL
Data
we construct a plant leaf disease severity assessment dataset (LDS Dataset) and a plant leaf healthy-diseased image pair dataset (LHD Dataset). LDS Dataset is derived from the PDDD dataset, incorporating 3,013 apple disease images, 3,854 potato disease images, and 5,216 tomato disease images, covering 15 disease categories with both simple and complex backgrounds. Additionally, we generate plant leaf disease images from healthy leaf images using an image generation network, producing 10,808 healthy-diseased image pairs, which is LHD Dataset, including 3,490 apple, 3,904 potato, and 3,414 tomato images. After collecting the data, we classify disease severity for apples, potatoes, and tomatoes according to these standards. Severity is determined by the percentage of the lesion area relative to the total leaf area. Using these grading standards, we label disease severity across both datasets. The datasets are then divided into training and test sets in an 8:2 ratio for experimental evaluation.
The code can be downloaded from there. The datasets of LHD Dataset can be download from there.Download the dataset to the './dataset' folder.
Pre-trained models
The pre-trained ResNet18, LGR-Net, and HLFA-Net models are uploaded. You can download it,and download them to the './weight' folder.
Get Started
Train LGR-Net
  python ./main/mainBackBone.py \
  --file_root ``The path of healthy-diseased paired images`` \
  --max_steps 40000 \
  --batch_size 16 --lr 2e-4 --gpu_id 0
Train HLFA-Net
  python ./main/mainClassifier.py --num_class 6 --epochs 100 \
  --data-path ./dataset \
  --model-path ``The path of the weights saved by pre-trained LGR-Net``
Inference
  python ./main/mainClassifierVal.py --num_class 6 \
  --data-path ./dataset \
  --model-path ``The path of the weights of HLFA-Net``
Results
Comparison of NDVI and segmentation methods

Table 1: Comparison of experimental results of different models and various data combinations. “Real” refers to the real dataset selected from PDDD. “Generated” refers to the diseased leaves generated by the diffusion model using healthy leaves. “Mixed” is a mixed dataset of real images and generated images.
Visualization of Lesion Area
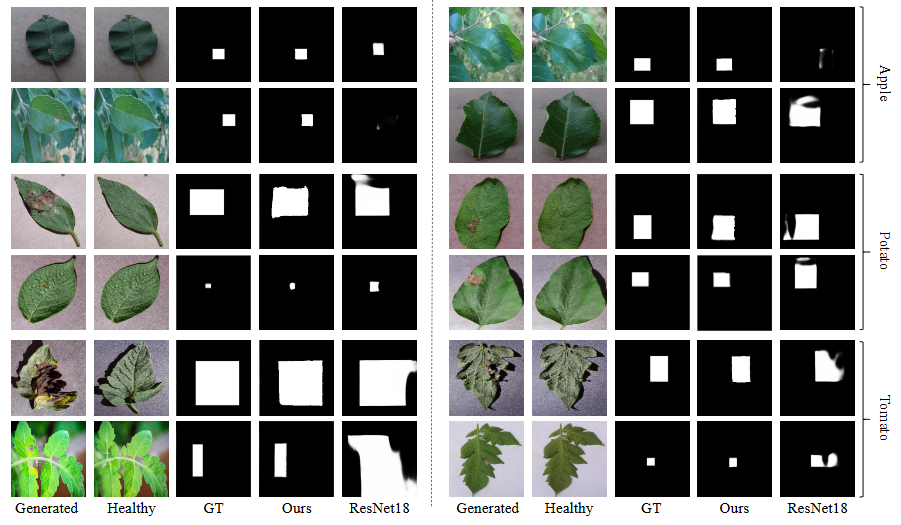
Figure 1: isualization of the localization effect of plant leaf lesion area and the generated images. “Generated images” represent diseased leaves generated based on healthy leaves through the diffusion model, “GT” represents the real lesion area, and “ResNet18” represents the lesion area localization result based on ResNet18.Hierarchical Feature Extractor Information
Feature Visualization from DBF-Enc
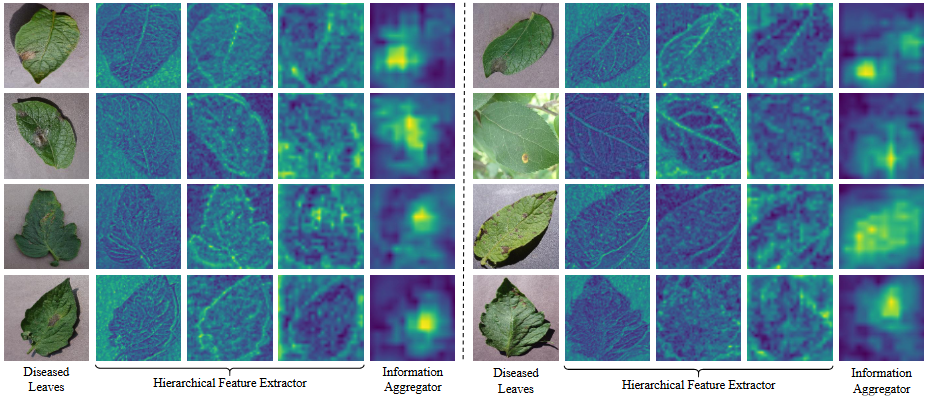
Figure 2: Visualization of features extracted by DBF-Enc. It shows hierarchical detail information features from the hierarchical feature extractor (HFE) and high-level semantic information from the information aggregator (IA).